

Note
Go to the end to download the full example code.
Connectivity per mode#
Two pairs of channels share different rhythms: channels a and b a slow one, c and d a fast one. Pearson connectivity of the raw series mixes both; per MVMD mode, each pair stands out in its own band.
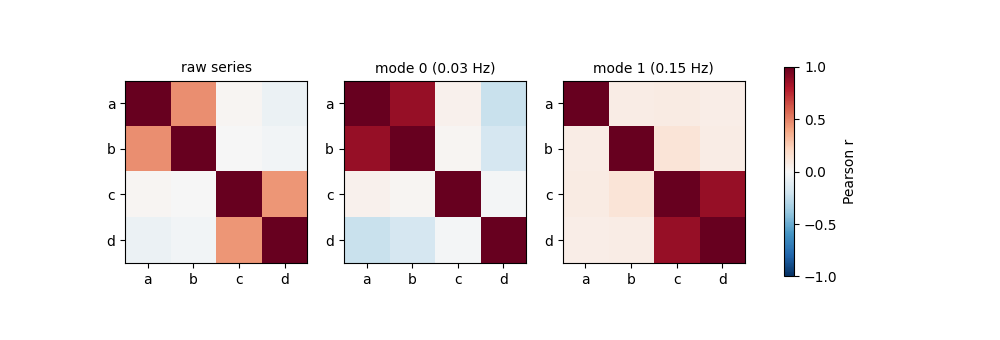
<matplotlib.colorbar.Colorbar object at 0x7ff2fbe8f4a0>
import matplotlib.pyplot as plt
import numpy as np

import modewise

fs = 1.25
t = np.arange(600) / fs
rng = np.random.default_rng(3)
slow, fast = np.sin(2 * np.pi * 0.03 * t), np.sin(2 * np.pi * 0.15 * t)
x = np.vstack([slow, slow, fast, fast]) + 0.8 * rng.standard_normal((4, t.size))
series = modewise.Series(x, fs, labels=["a", "b", "c", "d"])

raw = modewise.functional_connectivity(series)
modes = modewise.mvmd(x, fs, num_modes=2, alpha=2000.0, init="linear")
per_mode = modewise.functional_connectivity(modes)

matrices = [raw.values[0, 0]] + [per_mode.values[0, k] for k in range(2)]
titles = ["raw series"] + [f"mode {k} ({modes.centre_frequencies_hz[k]:.2f} Hz)" for k in range(2)]
fig, axes = plt.subplots(1, 3, figsize=(10, 3.4))
for ax, m, title in zip(axes, matrices, titles):
    image = ax.imshow(m, vmin=-1, vmax=1, cmap="RdBu_r")
    ax.set_xticks(range(4), series.labels)
    ax.set_yticks(range(4), series.labels)
    ax.set_title(title, fontsize=10)
fig.colorbar(image, ax=axes, shrink=0.8, label="Pearson r")
Total running time of the script: (0 minutes 0.063 seconds)