

Note
Go to the end to download the full example code.
Comparing two frequency bands across a cohort#
A small version of the frequency-amplitude case study on synthetic data. Ten subjects, three
regions: one carries extra slow-4 (0.027–0.073 Hz) power. The pipeline computes each run’s
spectrum, band_amplitude turns it into ALFF per band, and a paired permutation test compares
slow-4 with slow-5 in every region, with family-wise error control.
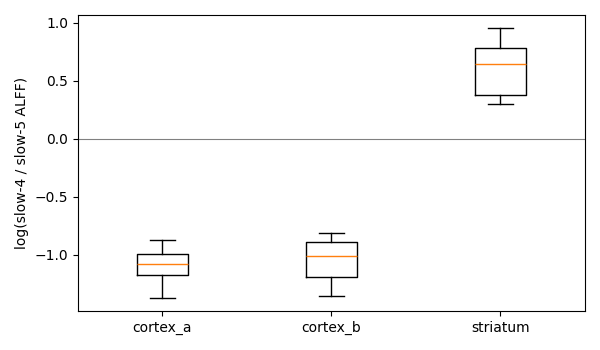
cortex_a  t =   -7.6   FWER p = 0.0020
cortex_b  t =   -8.9   FWER p = 0.0020
striatum  t =  +11.0   FWER p = 0.0020
import tempfile
from pathlib import Path

import h5py
import matplotlib.pyplot as plt
import numpy as np

import modewise

folder = Path(tempfile.mkdtemp())
rng = np.random.default_rng(1)
fs = 1.25
t = np.arange(488) / fs
for subject in range(1, 11):
    noise = rng.standard_normal((3, t.size)).cumsum(axis=1) * 0.05   # slow, 1/f-like background
    noise[2] += 0.7 * np.sin(2 * np.pi * 0.05 * t + rng.uniform(0, 6))  # the slow-4 region
    with h5py.File(folder / f"sub-{subject:02d}_task-rest_bold.h5", "w") as f:
        f["timeseries"] = noise

(folder / "labels.txt").write_text("cortex_a\ncortex_b\nstriatum\n")
dataset = modewise.Dataset.from_toml(f"""
root = "{folder}"
[[input]]
name = "bold"
pattern = "sub-{{subject}}_task-{{task}}_bold.h5"
format = "hdf5"
dataset = "timeseries"
sampling_rate_hz = {fs}
labels_file = "labels.txt"
""")

pipeline = modewise.Pipeline.from_dict({
    "pipeline": {"name": "amplitude", "inputs": ["bold"]},
    "step": [{"id": "psd", "op": "spectrum", "input": "bold"}],
})
batch = pipeline.run_dataset(dataset, folder / "results", progress=False)
table = batch.results.feature_table("amplitude", "psd", "band_amplitude",
                                    bands={"slow4": (0.027, 0.073), "slow5": (0.01, 0.027)})
report = modewise.test_paired(table, ("slow4", "slow5"), n_permutations=5000, seed=0)
for name, t_value, p in zip(report.feature_names, report.t, report.p_fwer):
    print(f"{name:9s} t = {t_value:+6.1f}   FWER p = {p:.4f}")

slow4 = table.values[[c == "slow4" for c in table.conditions]]
slow5 = table.values[[c == "slow5" for c in table.conditions]]
ratio = np.log(slow4 / slow5)
fig, ax = plt.subplots(figsize=(6, 3.5))
ax.boxplot(ratio, tick_labels=table.feature_names)
ax.axhline(0, color="grey", lw=0.8)
ax.set_ylabel("log(slow-4 / slow-5 ALFF)")
fig.tight_layout()
Total running time of the script: (0 minutes 0.072 seconds)